Site Updates
October 26th, 2025 - Edit Images on Existing Bulletin
October has been a fruitful month with a number of long overdue features coming in. The first and most important is that users can now edit images in their existing bulletins. This limitation originally came about because I'm bad at javascript and didn't know the best approach for editing existing images or adding new ones. So for the longest time users could only edit the captions on photos they've added. As part of the process, there's a brand new image uploading UI that's much nicer to use.
Keeping in theme with images, I've also added a "gallery" for images in the same bulletin. When you click on an image, you can now cycle through all related images for the bulletin rather than clicking and closing one by one. A few other noteworthy fixes:
- Fixed long standing bug where adding road conditions for an unknown section of road which has a more recent road report than yours, causes the road to not get updated. Thanks to kt and Steve for both reporting this separately
- Add an uptime/status page to keep track on the two services: backroadstatus.com and the Tile Server (used in Gaia, OSMAnd, etc)
- Fixed a bug on the road editor where you could not change/update any road features
- Fixed the distance markers so they're now generated as you draw the road
- Fix bug where logging out while viewing the copernicus satellite layer caused the map to not load after
October 1st, 2025 - Offline Maps & Site Overhaul
September started off with the launch of offline maps, which enables users to load road data into their favourite mapping application and download for offline use. Apps such as Gaia, OSMAnd, Caltopo and more should all work! Feeling fresh off the heels of this work, I decided to tackle the most ambitious overhaul of the site yet. Migrating to a new more flexible and powerful mapping system.
The site was built on Leaflet, which is a phenomenal mapping library, but it has limitations. For one, there's no support for 3D maps and generally speaking it only supports raster map tiles. That means if I wanted to move off of esri map tiles, I'd need to generate and store my own tiles for every zoom level. Part of the work with the offline maps did enable this, but I also wanted to remove some of the long standing technical debt that was necessary to get features from leaflet that didn't exist by default. Enter: Maplibre. A free version of Mapbox's WebGL mapping library. Migrating to this new mapping system cost me 3 weeks of long night time coding sessions after work, but I think it paid off. The logic is much simpler, the flexibility much greater and I was able to make a nice design overhaul of the site in the process.
August 14th, 2025 - User Submitted Road Features
It's been another mega busy summer out climbing in the mountains but I finally hunkered down and put out a feature survey on the site. Everyone overwhelmingly requested the ability to report/submit updates on road features like gates, bridges and more. This was honestly a very tricky feature to add from a user experience perspective and also my terrible javascript skills adding a certain constraint as well. Nonetheless, I'm pretty happy with the initial product and will continue to refine it as time goes on. Hopefully everyone finds it useful!
May 29th, 2025 - Enhanced Search Capabilities
In the first implementation of this site I had early support for searching by roads in the map. However, the experience wasn't great and I found searching by places was more useful. Users wrote soon after to say they were missing the search by road functionality. I was unfortunately busy with other priorities, but I've now updated the site to support searching by both places and roads in the same search bar.
March 31st, 2025 - Embedded Maps
Added support for iframes/embedded maps! One can you use iframes by adding https://backroadstatus.com/embedded.
March 9th, 2025 - Bi-Annual Road Import
I've completed the bi-annual data import for roads and cut blocks. The process gets easier each time, but lots of opportunity to automate things.
March 4th, 2025 - 2000 Road Reports
The backroadstatus site has now hit over 2,000 road reports since starting up in October of 2023. Thanks to all who have contributed! It's been a busy winter for me, so here's the small updates I've made so far:
- Added a dark mode theme to the site
- Update main map page to set location parameters in the URL. Users can now share the links to out people and the map location will load to your linked view
January 8th, 2025 - Small Features
- Added the concept of an "Active User" and added new mapping layers (weekly satellite images) for those users
- Implemented custom hybrid tile layer logic
- Refactored a number of poorly implemented sections of code to reduce technical debt
- Implemented comments on map features. Editors can now added descriptions to bridges, gates, etc and users can view them
- Fixed some bugs in the aforementioned implementation
December 9th, 2024 - Offline Roads and LMRP Zones
Lots of updates this time around!
- Total overhaul of the frontend logic. This has long been the area of most technical debt and I loathed to make any changes. It's now much cleaner and easier to update front end logic!
- I vowed not to make any more changes until I fixed the frontend code and now that is done I have added in support for offline road downloads. Users can now select areas on the map and generate KML files for import into their mapping apps
- Gave the FAQ page a much needed update. The design is much cleaner and easier to read
- Added in LMRP closure zones. Thanks to the Sea2Sky natural resource district for providing data on these!
- Changed the zoom out level on closure zones so they're easier to read
- Refactored the map editor to use much less brittle custom logic
November 13th, 2024 - Minor Site Improvements
More minor improvements to the site over the past two weeks:
- Removed automated flood notices as they weren't all that useful and it reduces complexity on the site
- Attempting to improve the user experience on the conditions rating slider:
- I've noticed users are having a hard time deleting or removing condition ratings so I've tried to improve instructions on that
- Moved condition rating details into a dropdown instead of a popup as it's less annoying
- Improve profile settings page to match user experience on other forms
- Minor code changes to improve maintainability
- Fix bug on road update feed that would cause the incorrect distance to be displayed
- Update the way condition breakdowns by kilometer are displayed on road pages
October 31st, 2024 - Add Notice Details
Added a few minor improvements. Namely adding more information about notices on roads
- Add notice count to popups on the map
- Display notice updates in the road update column on the main page
October 21st, 2024 - Bugfixes and Spam Control
Well the day has finally come! Spam bots have arrived. So far they're just registering a boat load of accounts. I've added in some protections and I'm hoping I won't have to resort to using captchas. In the mean time, I've deleted all of the spam registrations. In the past few weeks I've just made a few minor updates:
- Fixed a bug where moving the condition slider to the beginning broke the road page
- Added in an edit conditions page for admins/editors so that they can override conditions without submitting a bulletin
- Fix a bug in the recent road reports due to how the condition points are serialized in the database
- Remove the old path condition field now that we support multiple conditions
- Ran an import for all cut blocks and roads
- Add registration form spam protections
October 6th, 2024 - Multi-condition roads!
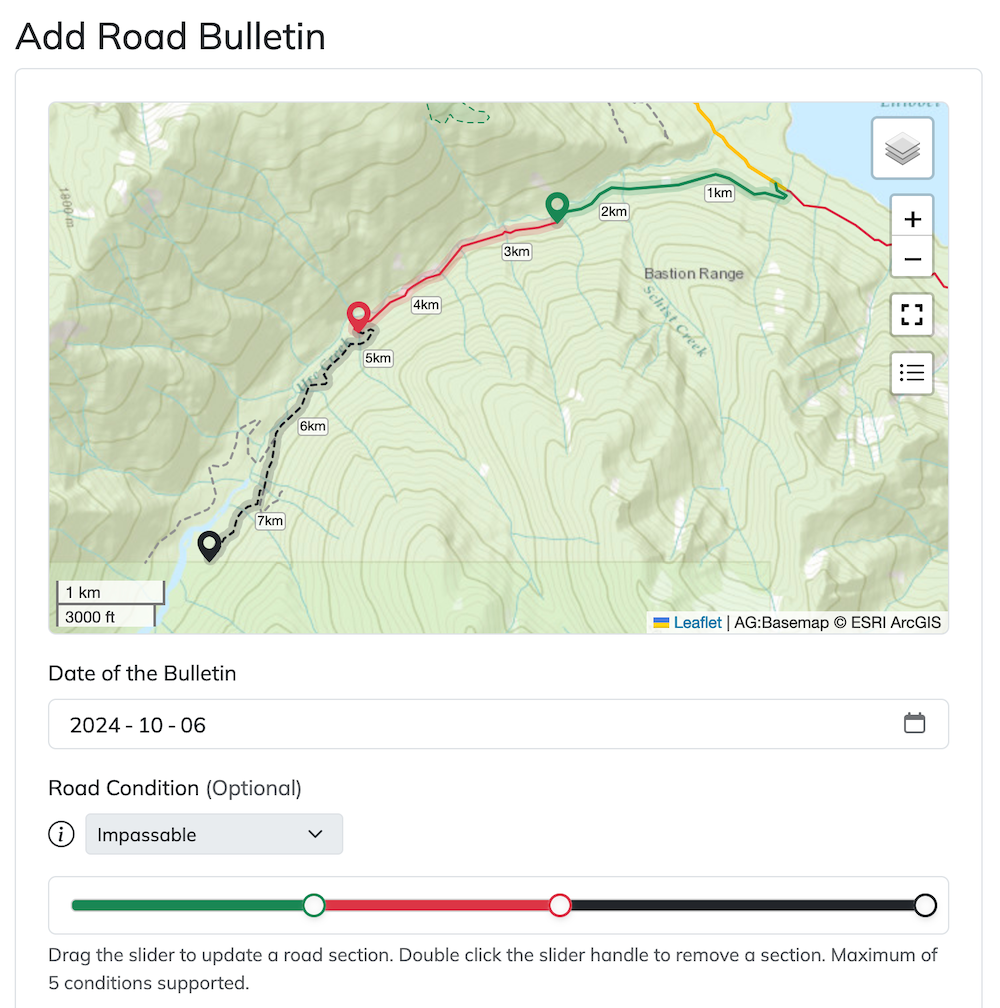
Road condition ratings have been a fundamental aspect of this site since its inception. However, it's had some major limitations. Namely that the condition ratings apply to the entire road and that each road can only have one condition. As you can imagine this leads to an inaccurate picture for many roads. Some are smooth sailing for the first half and completely impassible after. Do you then mark the road as good condition or impassible? I've long known that multi-condition road ratings were the answer to this and it's been one of the most requested features for the site. However, it's technically quite challenging. There's the issue of how to render/display a road with multiple conditions, how to store it in the database and how to handle users adding new reports, road geometry changes and so on.
I finally set about tackling this issue over a month ago. I won’t get too technical, yet, but there were multiple complex changes that had to be made to support this functionality. I had to develop a custom plugin for rendering multi-coloured roads, custom merging and reconciliation logic for condition ratings and a simple to use condition rating slider for users to add their ratings.
So with that, I’m pleased to announce multi condition road ratings! I hope you all enjoy the feature. It was a major challenge to create, but an enjoyable one at that.
September 18th, 2024 - Small Updates
I've been working behind the scenes to get multi-condition road bulletins up and running, but there's lots of work left to do. In the mean time I've made a few small tweaks/updates
- Large roads (>= 15km) will now appear even when zoomed out further than normal. This will make it easier to visualize them and scroll around
- The road bulletin form now includes a map preview, so it's everything you need is in one place
August 30th, 2024 - Add Wildfire Layer for Alberta + New Domain
It's long been time to have a more official website name than roadstatus.searchthesummits.com. So I've migrated the site over to backroadstatus.com! I'll keep the old domain around for awhile to ensure content stays accessible, but in a month or so I'll officially shut it down. This new URL will hopefully be much easier to memorize and type in!
I've also included the Alberta Wildfire's layer so users can view active fires for both BC and Alberta now!
August 23rd, 2024 - Improved Map Search + Anniversary
It's officially been one year and a few days since I started testing out an idea for making a service road status site! At the time there were a number of resources like Backroad Mapbooks or Bivouac.com which all had a road report feature, but required a paid subscription. I felt very strongly that for a site like this to succeed it needs to be free and open for all to contribute. So I set about seeing if I could make a free alternative. By some luck the BC Government had a pretty good dataset with all of the main service roads available for download and use. The data needed a lot of work to have it ready for the site and many roads have since had to be manually added in. But it was a great starting point and I'm very thankful for its existence.
Initially I wanted a very simple core set of functions:
- A move-able map that would load new roads as you scrolled around
- An ability to add reports with photos to a specific road with an easy interface
- A straightforward sign up process with minimal friction
I shared the site for the first time on October 4th, 2023 with those core functions in place and since have added a significant amount of features. Some user facing and some admin-side. I'll list a few of them below:
- Road ratings on bulletins which automatically update the road condition on the map
- Street labels on the map
- Download-able GPX waypoints
- Facebook Login
- Unified road editor for maintainers and admins
- Road bulletin comment system
- Email notification system for comments and road changes
- Wildlife closure zones
- Automated flood watch for Squamish River area and Lillooet River
- Cutblocks and Wildfire display on the map
- Pinned bulletins
- Numerous code optimizations to make the map feel as seamless as possible
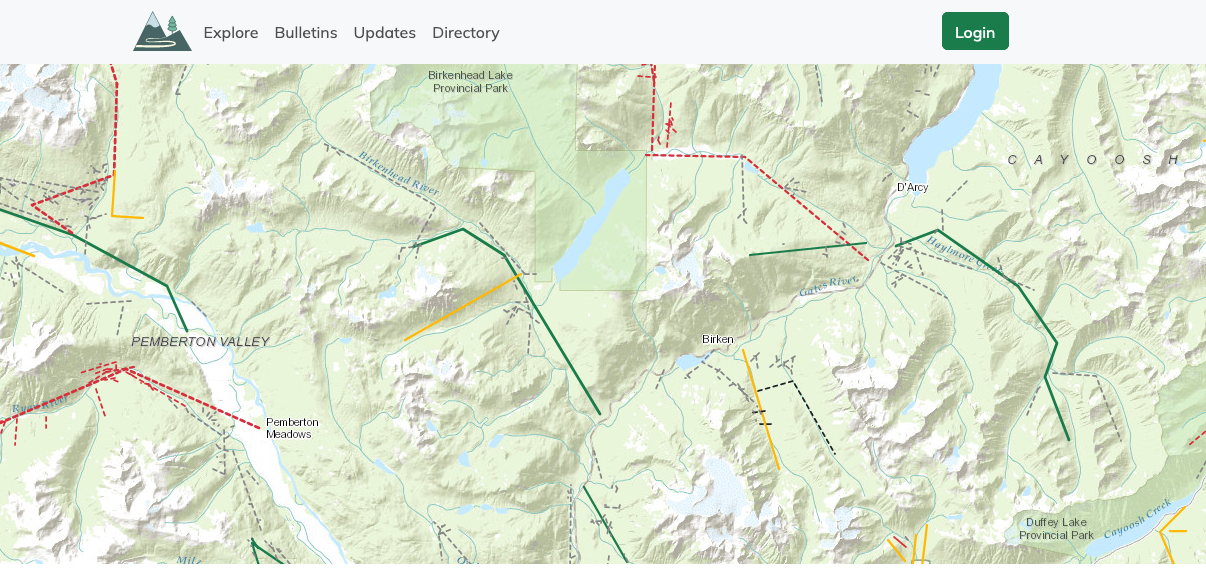
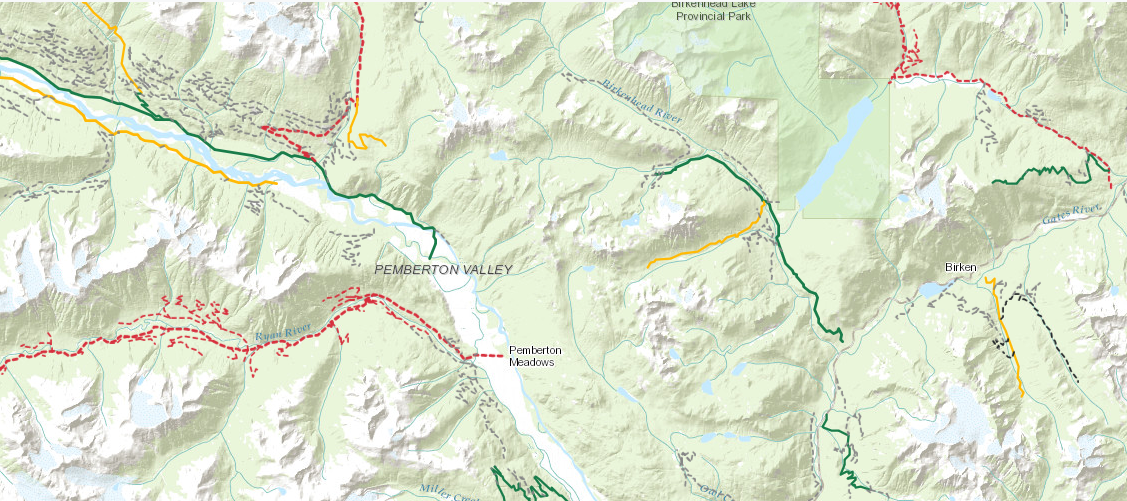
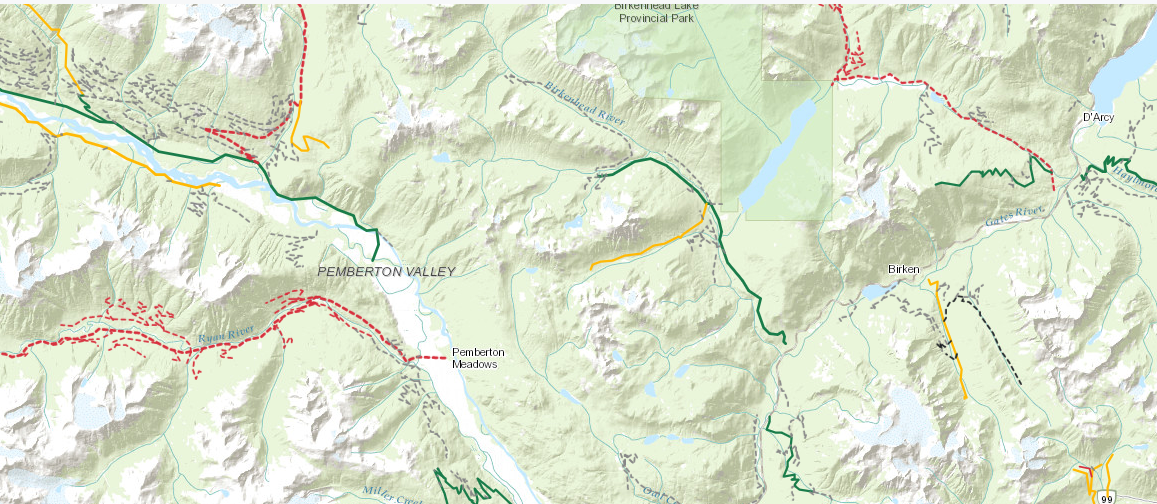
The list goes on, but you get the idea! Just for fun here's the very first photo of the website I took when I started development:
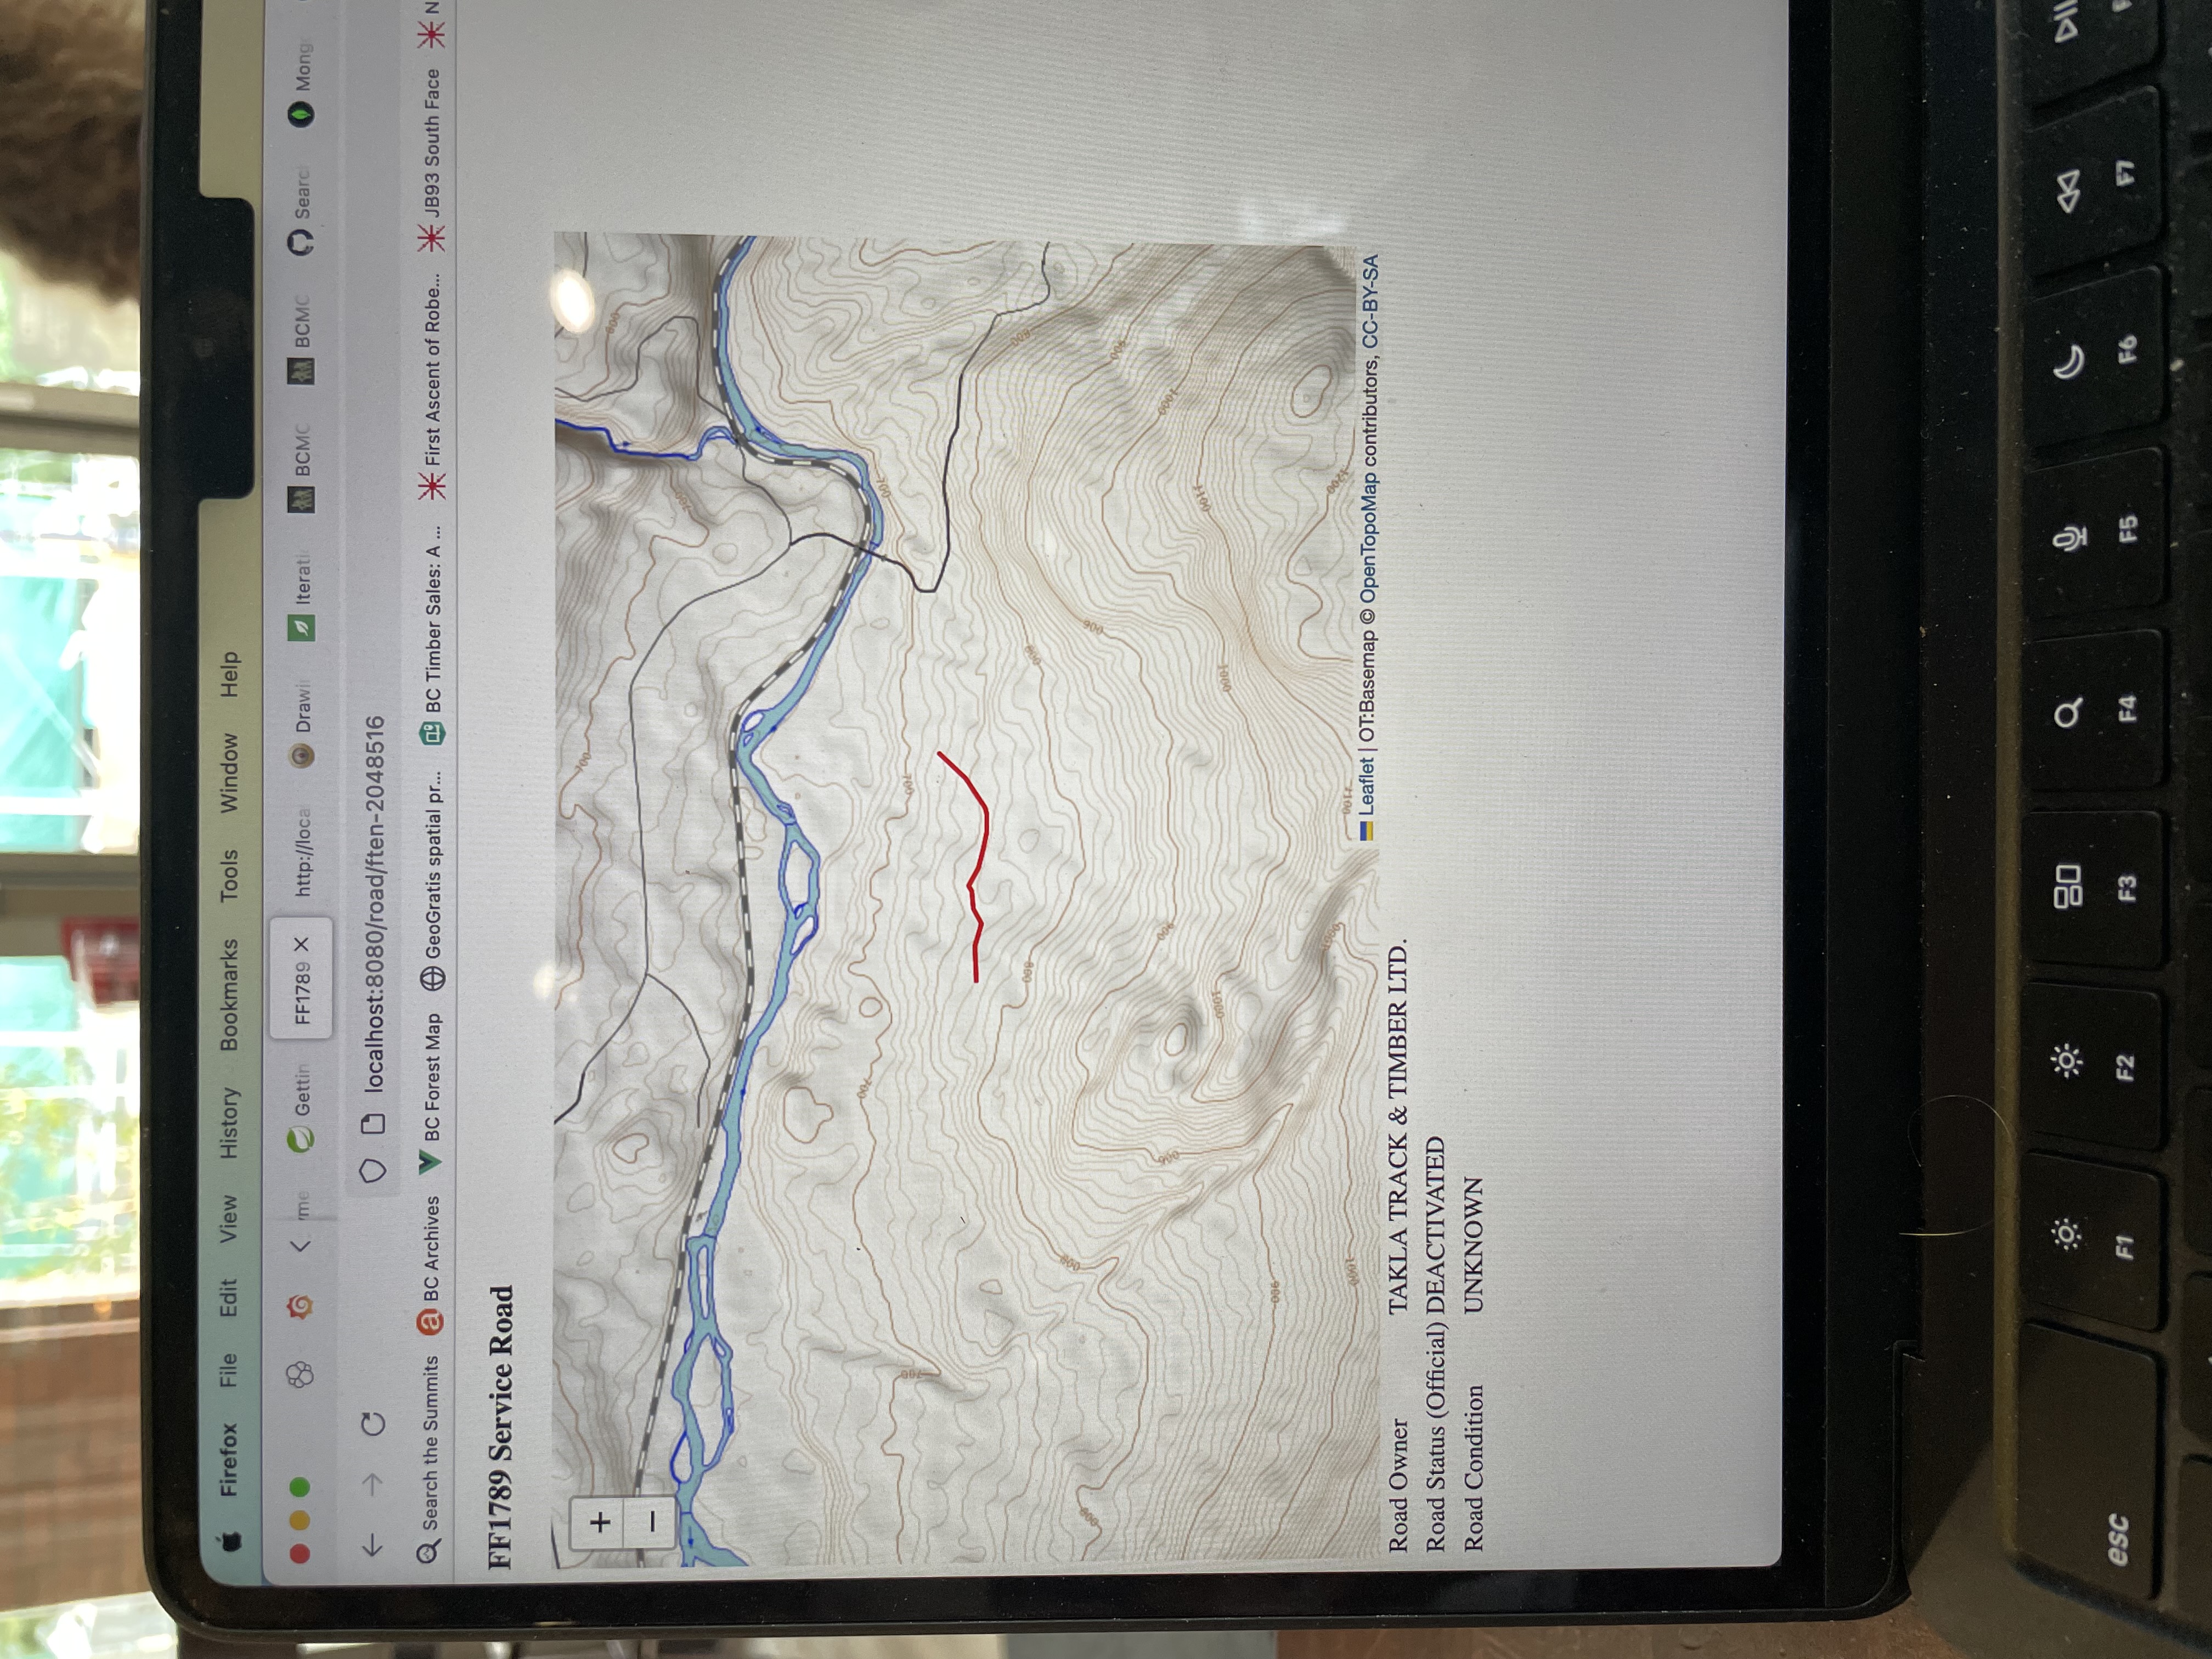
It's certainly come a long ways! Much more to do, but I'm very happy with where the site is. The main focus is on continuing to promote it as the more people use it the better it gets.
In other news, I've made a few changes to searching! The search functionality has always been a bit limited on the site and that's in part because the underlying datastore doesn't support a very rich search functionality. What's more is that you could only search roads. However, it occurred to me that most users don't know the specific roads to take. They're more concerned with the destination. So, I've overhauled the search bar and it now uses a third party API to search places as opposed to roads. For example, you can search Stoyoma Mountain and the map will zoom in on the peak and load all the roads around it. I think this will make planning for a journey, much much easier!
Other Updates- Updated bulletin comment size from 200-500 characters as 200 is just way too small
- More minor visual improvements
- Over 114 FSRs added on the Alberta side now. Many to go, but lots of the key ones are added in
August 17th, 2024 - Bugfixes and Content Updates
It's been a busy alpine climbing seasons, so I haven't had much time to make updates. However, the site is moving along well and I feel the site has reached a mature state. I still have lots of ideas for improvements but for now they will be small ones so I can focus on taking advantage of summer!
- Fixed webp bug caused by not bundling webp dependencies in docker build
- Small improvement to road creation UI to reduce manual inputs
- Minor and hopefully subtle visual updates
- Continuing to add more roads on the Alberta side, but it's slow going
June 26th, 2024 - Webp Support
Another very small updated. Added support for uploading webp images from the bulletin as per a user request. Thanks to all who provide feedback, you help make this a better site!
June 15th, 2024 - Small Updates
I've been pre-occupied with some life events, so updates have been put on pause. However, reports continue to flow in so thanks to everyone who has been adding them. We're now at over 1,000 road reports!
- Minor updates to privacy policy to appease the Facebook App review process
May 17th, 2024 - Active Wildfires
With an early start to fire season, I realized it would be useful to find a way to display wildfire information on the map. After doing some sleuthing on the Wildfire Situation website I discovered there are a number of actively updated datasets available to the public. Normally, I'd import these datasets into the road status system, but for such a frequently changing set of information it didn't make sense to implement new logic for storing and displaying it. Thankfully leaflet/esri support adding layers from external datasets without any modifications required on the road status side of things. This made it fairly trivial to incorporate new data layers such as fire perimeters and fire points on the map! I did have some issues with layer ordering causing roads to no longer be click-able, but resolved it by using SVG rendering for fire information instead of the canvas renderer.
Other Updates- Added fire details to the map legend
- Fixed bug on road notices that would cause incorrect notices be deleted when they expired, if there was more than one expired notice
- Cleaned up unused javascript
- Implemented a delete bulletin feature for users
May 9th, 2024 - Minor Updates
Just a few small updates this time around, while I investigate multi-condition road lines and some other requested features.
Updates- Updated the about page
- Updated text on closure zones to say "Year Round" instead of "January 1st to December 31st"
- Minor formatting changes to the footer menu
That's it while I'm vacation for the next while! I have plans to support multi-condition roads next. For example a road that changes from good condition to impassible midway through
May 1st, 2024 - Map Editor & Closure Zone Improvements
Updated the map editor to allow existing roads or roads that were just drawn to re-enter "draw mode" and continue adding new points and remove waypoints in bulk. This was a major pain point and sole reason for not allowing other users to edit roads. I felt the experience would be too buggy and unusable. What do I mean by that though? Well the map editor has two modes: draw & edit. When you create a new road, the map editor uses the "draw" mode and any time you click on the map it will add a new point and connect the road segment from the last drawn point. The map editor will consider the road complete when you click "finish" or click on any existing point on the road you've just drawn. However, if you're drawing a super long road and it happens to have tight switch backs then you'd end up turning off draw mode accidentally when clicking on a nearby waypoint on the switchback. There was no way to re-enable draw mode and so you'd either have to start all over again or put the road into "edit mode" and manually drag each road waypoint along the map. Another pain point was removing parts of a road. The government datasets tend to have very dense amounts of way points for each road and so you'd have to remove 500 waypoints just to delete one kilometer of road. Now you can select an area of waypoints and simply delete them! These updates were long overdue both for my sanity but also for opening up the editor to allow others to make contributions. It paves the way for the "suggest an edit" feature I've had on my radar for awhile now too.
I've also completely overhauled wildlife closure zones and how they work. When I first added them in, the government only had zones from the Sea2Sky available for download and import into the system. So I added them with the intention of manually drawing the rest. However, I started to realize that the closure zones further east were quite complex. They had numerous exceptions like "road A open Jan 1 to April 1, road B closed all year, road C open...". I made the decision to add logic to support these exceptions/overrides while still marking roads in the closure zone as closed. A week ago I discovered that the complete set of closure zones had been added to the government data catalogue at last and immediately looked into incorporating them into the site. I realized after looking through the data, there was no sane way to manually add in all these road exceptions. So I decided to simplify everything! Closure zones no longer mark roads as closed. Instead a notice will be posted on the road (thanks to the notice system overhaul) with a link to the regulation/map. Users can then figure out what the policy for the closure zone is. This ensures that the regulation can change without updates needed on my side, while still informing users that a given road may be affected by vehicle closures.
Updates- Improved map editing logic for better user experience
- Added in ability to remove large sections of road (still a bit buggy)
- Imported all closure zones listed in the Wildlife Act: excluding hunting and ~8-10 zones with bad geometry that I'm working to fix
- Fixed bug on photos not displaying for pinned bulletins
- Added in share link on bulletins to make it easy to post/link back
- Implemented "Editors Menu" with editor guide and easy access to create new roads
April 24th, 2024 - Pinned Bulletins
I've added another small update and that's the ability for admins and maintainers to pin bulletins to the home page. The hope is that especially important bulletins can be highlight on the home page for a longer period of time.
Other Updates- Update closure zone links as new legislation and documents are now available for the Wildlife Act
April 16th, 2024 - New GPX Download Options
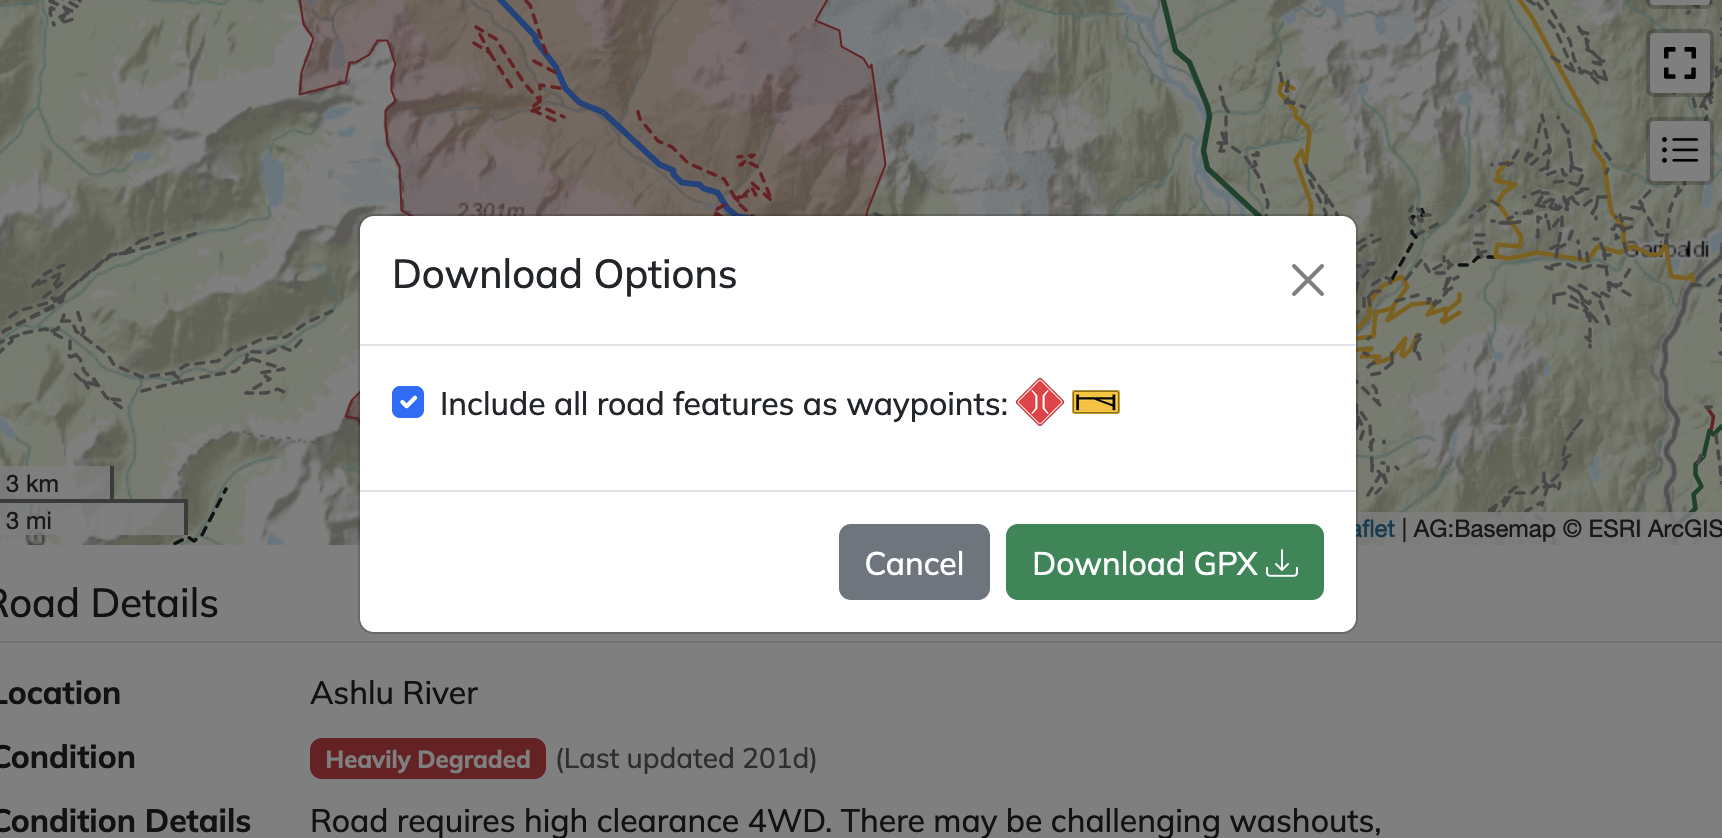
I haven't done many updates in the last month, but that's because the site has reached mature point where I feel enough features are in place for it to run itself. With that being said, I was feeling another wave of motivation to make some improvements this week. One feature I've wanted to add for a little while was the ability to include road features such as bridges, gates, etc into the GPX download on the road page. I recognize not everyone wants waypoints included and so I've introduce a new download dialog that lets you select whether you want to include features or not. This work required a bit of an overhaul on how I store features in the backend, but now that's completed and in a much better place.
- Optimized the closure zone logic so that it's not re-closing the road every day.
March 18th, 2024 - Overhauled Map Legend
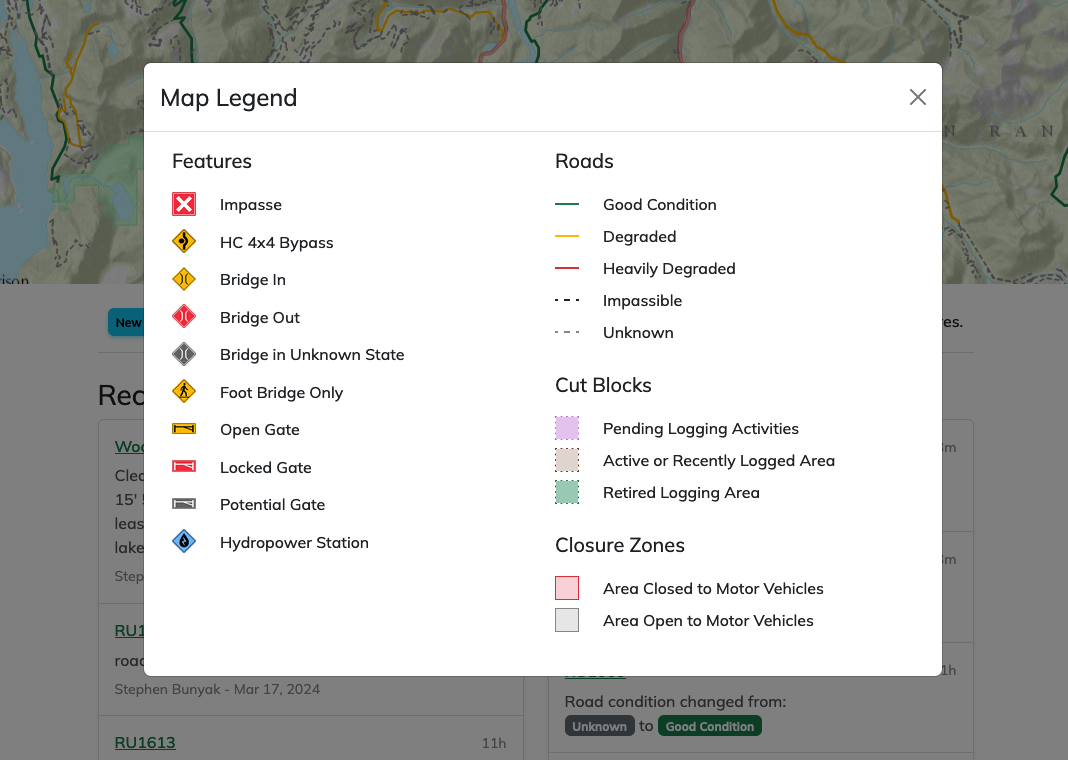
Since adding in a basic map legend, many new features and map elements have been added to the map. None of these have been added to the map legend, as it was difficult to update. The design was also limiting and would be challenging to accommodate all the new map features. I've had it on my list to update for a while and now it's complete! See below or click the map legend icon on the map!
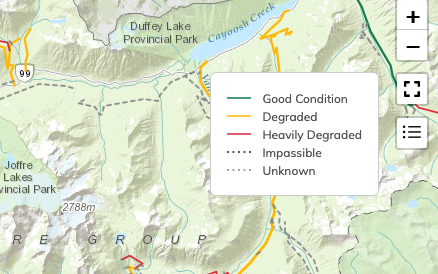
- Fix bug with closure zones where dates that wrapped around the year e.g. September 1st to January 1st were not working correctly
- Overhaul the user experience for adding bulletins and watching roads so that there are more clear calls to action
- Fixed bug where roads closed by a closure zone where not being updated on the home page
March 12th, 2024 - Introducing Cutblocks!
Users can now view pending, active and retired cut blocks on the map! Roads alone don't tell the whole story and if a given road has no reports, recent logging activity can give you clues about the status of the road. New cut blocks also indicate where logging road access is going to improve and what new areas will open up to explore. This update really starts to form the map into a cohesive road research tool. I hope everyone enjoys using the new overlays as much as I do!
Other Updates- Updated the map layer selection menu and settings will now persist across page refreshes
- Updated the closure zone logic to support road exclusions
- Continuing to import or hand draw the wildlife vehicle closure zones
- Security and dependency updates behind the scenes
- Add better metrics around the registration flow
March 1st, 2024 - Importing New Roads
I designed the system from the get go to support importing new roads as the FTEN dataset (BC Gov's road data) evolved! When I first imported the road data, I kept track of a unique object (road) id from the government dataset, so that when I would reimport new data, I could check and deduplicate existing roads. In the name of moving quickly to develop features, I didn't do my homework and discovered a major issue with my approach. Yes.. this is a common pattern in my project, but so it goes in the pursuit of trying to deliver features as quick as possible.
Anyways, I found out the unique ID I was using changes any time a road is updated and as such not useful at all for eliminating duplicates. From this began a long journey of finding out that the BC FTEN dataset is managed by a lot of people, each with their own methods and processes and none of which are standardized. That means finding a set of properties to uniquely identify a road and track its evolution through the system is only possible in about 96% of cases. That's not bad, but 4% of ~269,000 roads is a lot roads to clean up and fix still. I even reached spoke with some of the GIS support team from FTEN and it turns out that most people simply import the latest version of the dataset, do their analysis and discard it. They usually do not need to persist road information and as such uniqueness of each road is not important. I also learned the reason that my existing road set has quite a few overlapping/duplicate roads. When a road is marked as retired, they generally stop displaying it on the map. So rather than modify retired roads, employees will simply draw over new roads and as such duplicates are born. I could resolve this issue for myself too by only displaying roads marked as active in the system. But I want to preserve all roads for historical reasons and because they may be of use for foot/bike travel still.
Through lots of trial and error I did find a somewhat palatable solution and had to adorn all existing roads in my system with a new set of fields from the dataset to make it possible. I couldn't and won't ever be able to eliminate all duplicates as it requires too many heuristics. But, I can get close enough to manage it for now. With that you'll notice that around ~3,000 new roads were added to the system today. The first of a likely bi-annual process to import the latest datasets.
I am considering one alternative, which is to take the latest road dataset and simply apply existing road reports/created roads on top of that. In that way, I won't have to do any deduplication checks. But it's risky if they remove old roads, or roads with reports associated to them. Something to think about for the future.
Other Updates:
- Updated closure zones to disappear when you zoom in to a road further.
- This makes it easier to click around on roads and makes the map more legible overall
- Overhauled naming scheme of roads. In some cases they will be less meaningful names, but it reduces unwieldy and usually uninformative road names
- Uppercased road names when they're drawn on the map for better legibility
- Added location field on each road page
- Added report date field on the road bulletin feed to make it more clear when the report was for
February 20th, 2024 - Overhaul of the Notice System
An important aspect of any road system like this is being able to easily highlight key information to users. These are things like road closures, construction, gates and more that are important to know right up front. Prior to today, a big notice would appear on a given road page for any posted road closures. However, this system was limited as there are other types of notices that are worthy of being highlighted. What's more is that notices in most systems can become stale if they are not being actively cleaned up. That's a hard task in a system with 290,000+ roads.
That's why I spent a fair bit of time implementing a better notice system. Now admins can post important notices about anything that's worth highlighting and it will appear at the top of the given road page just like road closures. I've also added in an expiry mechanism so that notices can be given a specific end date and the system will automatically clean them up. I used this to my advantage to automatically post notices to roads where flooding was detected. Users viewing previously flooded roads will be made aware of the recent flooding and that road conditions may have changed. After 5 days the notice will expire and be removed!
Now I'm working on getting the system ready to import new road updates from the FTEN dataset. That's exposed a whole whack of issues that I'll dive into more on the next site update.
February 16th, 2024 - Minor Bug Fixes and Improvements
- Added in Texas Creek closure zone
- Fixed annoying popup bug on mobile devices where clicking a road would cause the map to move and the popup to disappear
- Fixed bug on iPhones where some road names would appear as phone numbers
- Improved the display of road aliases to make them easier to discover
- Added notification badge for mobile devices, if you have notifications
- Users can now change their location on their profile by editing their profile settings
These were just some minor updates while I work on overhauling the system that displays important notices about roads. I'm going to add support for temporary notices and displaying multiple notices at a time.
January 28th, 2024 - Introducing Closure Zones
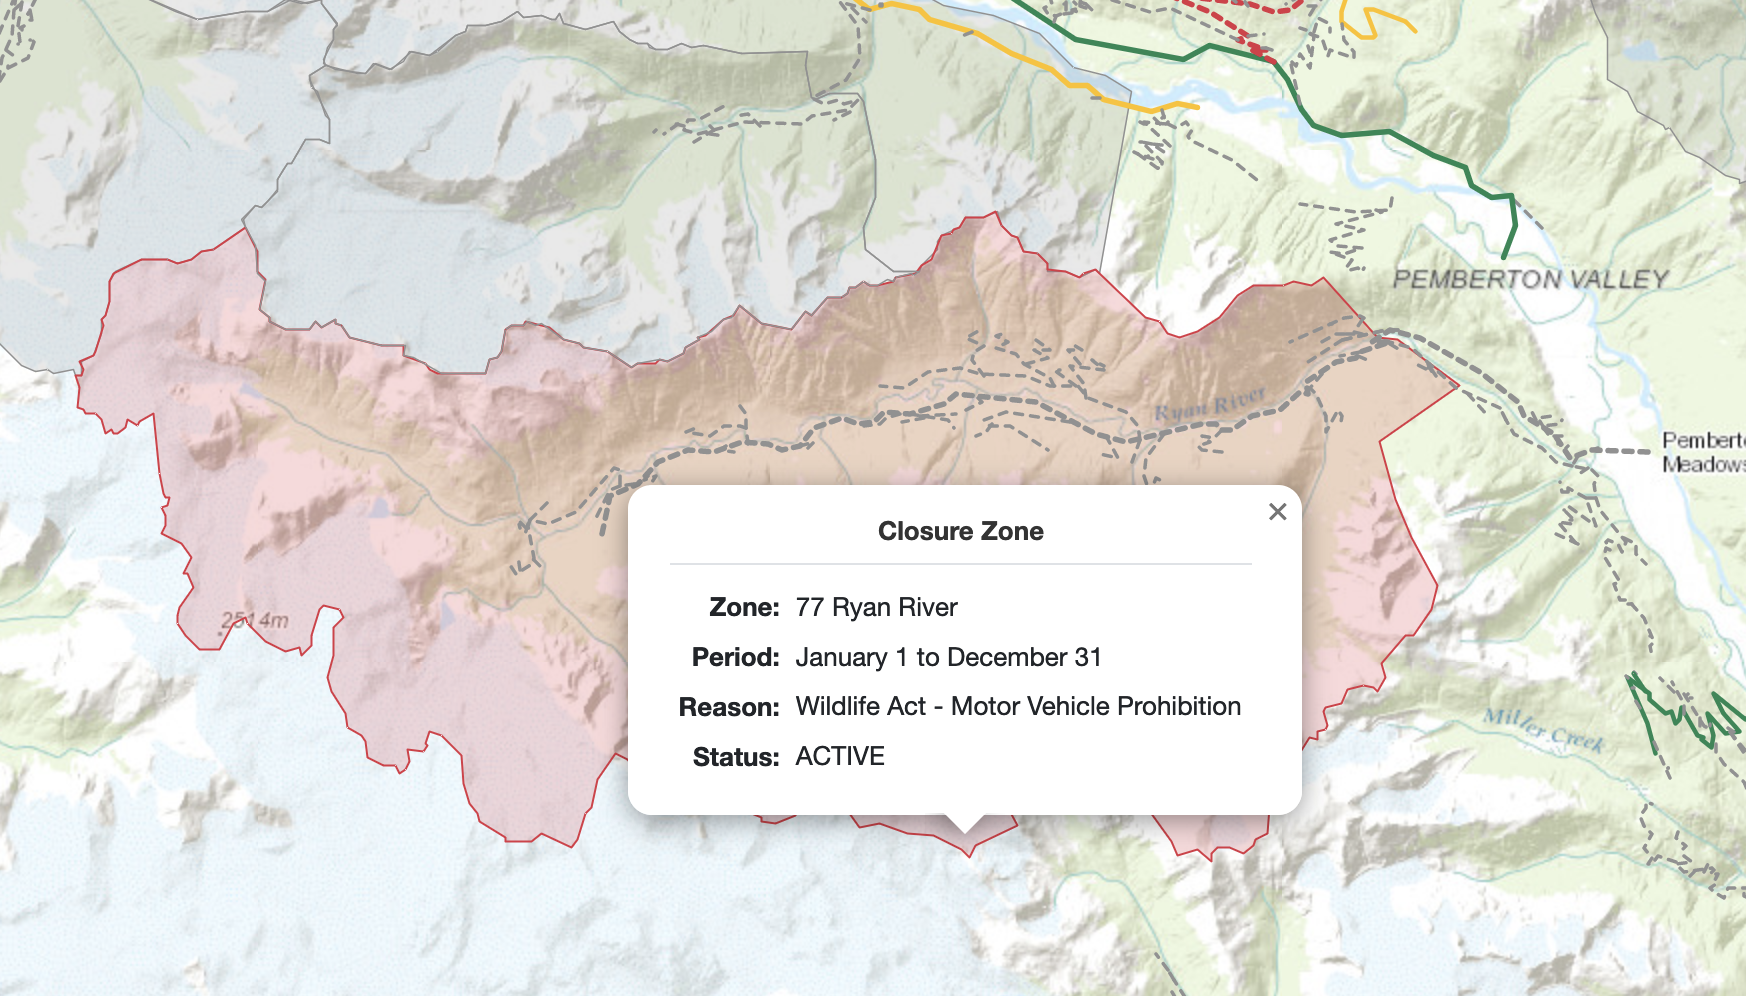
In order to protect wildlife during sensitive times, the government of BC often restricts motor vehicle access to roads running through certain areas for fixed periods. However, finding out about these closures requires you to consult this massive document and look for all roads you intend to cross. That's if you're even aware the document exists. These closure zones are poorly advertised and most people find out the hard way. Either driving for long distances to reach a locked gate or getting yelled at on social media after the fact for not knowing better.
Well the days of guessing are over! I've now added closure zones directly onto the map. You can see active closures as well as currently inactive ones to get an idea on whether your route will be impacted. Furthermore, if a zone becomes active all roads within that zone will automatically get marked as closed with a notice on the road page as well.
I'm starting with the closure zones in the Sea2Sky area first as those were available for download from here. However, the other zones need to be hand drawn and imported. I will do this in my spare time until they're all complete.
January 27th, 2024 - Optimizing Response Times... Even More!
While working on a new feature to display wildlife closure zones, I had to reduce the number of waypoints used to draw these zones on the map. I was using a Kotlin version of Simplify JS and it occurred to me that maybe I could run this when returning road waypoints as well. It's actually not the first time I thought of using this, but my original idea was to modify all the underlying data to remove unnecessary waypoints. However, I never quite found it palatable to irreversibly modify all the road data like that. Simplifying the coordinates before returning the road waypoints to the map might be the best of both worlds here. It should in theory drastically reduce the amount of data transferred and time spent drawing the roads as well as leaving the underlying data untouched.
I had a feeling that it would incur a high server-side time penalty doing all that extra processing, but there's only one way to find out! So, I added in a test parameter to the api called tolerance that I could then set to different numeric values to find the balance between reduced road waypoints and a still well defined road. You see if you remove too many waypoints the roads will look like straight lines with sharp jagged corners. Not great for a map! The results were pretty spectacular. To my surprise the server side penalty was negligible. We're talking just a few ms!!
There was one problem though. If I reduced the number of way points by a certain amount, it would look fine at the given zoom level, but then as you zoomed in further the roads would look horrible. It then occurred to me that I could set the optimization level based on the zoom level of the map. When you're very zoomed out you can't see the finer details of the road anyways, so might as well aggressively reduced the number of waypoints. These zoomed out requests also happen to be the slowest as it's' including roads from a massive area. As you zoom in, you want more granular road data and so waypoints are reduced even less. Finally at the smaller zoom levels, the amount of data being returned is so minimal that no optimization is needed and we can return the highest fidelity road data. LeafletJS, the client side javascript map I use, actually already does this to save map drawing time. But the server still has to send all those unoptimized coordinates first. So it makes sense to do it on the server side too,
Results
To test the results, I chose 3 different zoom levels on the map and picked a relatively dense area. I then ran the requests multiples times for each zoom level to get a sensible average.
| Zoom Level | Average Response Time Before | Average Response Time After | Delta |
|---|---|---|---|
| 11 | 955.83ms | 532ms | -45% |
| 12 | 359.67ms | 219ms | -39% |
| 13 | 135.5ms | 102.8ms | -24% |
| Zoom Level | Data Transfer Before | Data Transfer After | Delta |
|---|---|---|---|
| 11 | 1540.00kb | 159.61kb | -90% |
| 12 | 538.49kb | 100.60kb | -81% |
| 13 | 241.39kb | 98.53kb | -60% |
As you can see the response times and total data transferred are drastically reduced. This will make the map feel snappier than before, even with slower connections. The minor trade off is that some roads have a lower fidelity appearance at certain zoom levels, but its subjectively quite negligible.
January 22nd, 2024 - Optimizing Response Times
Alright, this update is a subtle one, but in my opinion the numbers show it's worthwhile. It all started a few weeks ago when I discovered what each decimal place in the latitude/longitude waypoints of the road represented. I found out that in a pair of coordinates like 49.123456789, -121.123456789 the 5th decimal place represents 1.1m of precision and the 6th decimal place represents 1.1cm. Beyond the 6th decimal place the precision is so small that it's really no use for something like road waypoints.
Why is this relevant? Well the government dataset that the Service Road Atlas is based off uses coordinates with up to 13 decimal places!! Not only is it highly unlikely the government was measuring roads with nanometer precision, it's way more information than we'd ever need.
Let's take a road like Harrison East FSR. It has 2368 waypoints with a latitude/longitude having 13 decimals each. Remember, we only need 6 decimal places. So, that's 7 extra numbers for each part of the coordinate pair. Not only is that a lot of extra data to store in the database, it actually significantly increases the load times on the road map because all of that extra data which must be transferred to your browser.
I was aware of this issue a few months ago and put a small band-aid in place. Before serving the road waypoints, I would truncate the lat/long values to 5 decimal places which reduced the network transfer time. However, all that extra processing had a noticeable increase in CPU time taken to process the request before serving it. I knew I'd need to address it by updating all entries in the database to use 6 decimal places, but it's a bit scary to change the ~260,000 road entries in one shot.
With some testing, I decided that I wanted to use 6 decimal places instead of the 5 I had been serving. The reason was 1.1cm seemed better than 1.1m even if it's unlikely the dataset is really that accurate. The one downside to this is I'd be serving up slightly more data (there's one extra number in each coordinate now) but with less CPU time spent compressing/truncating the values. After some rigorous testing and backup policies in place I finally ran a coordinate optimization pass today and the results are instantly noticeable! The data transfer time for the extra decimal place is definitely offset by the reduction in CPU time spent serving up the request.
Testing was done against the same set of coordinates and the numbers are as follows:
| Average Response Time Before | Average Response Time After | Delta |
|---|---|---|
| 610ms | 480ms | -22% |
| Data Transfer Before | Data Transfer After | Delta |
|---|---|---|
| 2.96mb | 3.18mb | +7% |
So we saw ~7% increase in data transferred but that still resulted in 22% reduction in response time overall. Now for users with extra slow connections they may not realize this benefit, but I feel the average user will certainly feel the map being much zippier!
January 18th, 2024 - Contribution Points System
First update in the new year, as I was quite busy participating in interviews for a new role! I ended up getting an offer and so work on this site will slow a bit as I transition to a new company, but rest assured I will continue to develop some new ideas I have! The new updates this time around are minor but worthwhile changes and some bug fixes
- Added a contribution points system. You can view your points on your profile page and the top contributors over at: Top Contributors
- Fixed display bug where ampersands: & would get displayed as &
- Added support for link highlighting in comments and bulletins as well as newline formatting. This will give users more power to format the bulletins how they see fit
- Updated the profile page to match the bulletin feed design found throughout the site
- Fixed bug that would cause users to see a 429 error page when using the site as normal
December 20th, 2023 - Road Watch
Last big update of the year: "road watch" is now live. Registered users can now subscribe to road updates and receive notifications and emails whenever a road they're watching has a bulletin posted. I've also extended this system to forward comment notifications to your inbox if they go unread for more than 24 hours
Don't want to receive emails? No worries, there's an email preferences page where you can unsubscribe from your profile or through an unsubscribe link in your email.
December 20th, 2023 - Comment System!
Another big site update! You can now add replies to user contributed bullets! Have a clarifying question or just a general comment? You can now leave a reply and the creator of that road bulletin will get notified. This work required creating a notification system which paves the way for notifying users when roads change.
A few other changes of note:
- Fixed bug that would prevent users from seeing a useful login error if their email was pending verification
- Fixed bizarre bug where updating a bulletin photo caption with only one photo resulted in a 500 server error
- Increased session timeout to 1 hour (it was intended to be this way all along, but there was a bug)
- Added in most of the hydro projects around BC as these may indicate good road access
I will work on a road watch system next and email notifications (unless there's no desire for this)
December 8th, 2023 - Minor Updates
Just a few small updates this time around, while I work on implementing comments/replies on bulletins
- Reduced icon sizes... these were like 2000x2000 px... whoops!
- Added clearer messaging about checking your spam folder after registration
- Updated/drew in a bunch of roads around the northern part of Harrison Lake
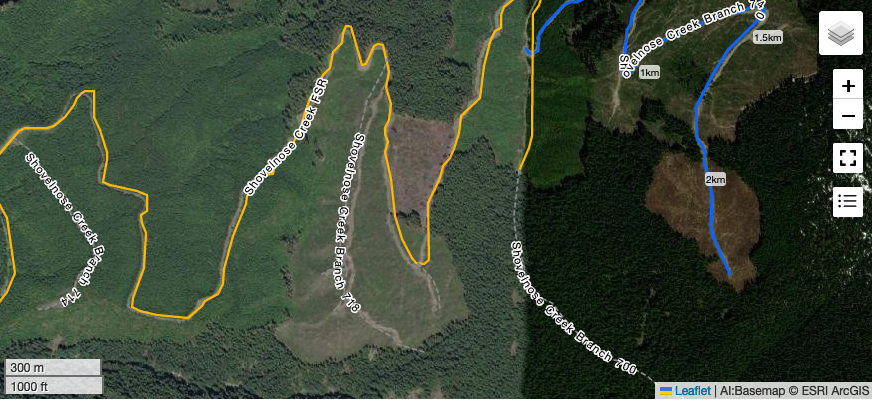
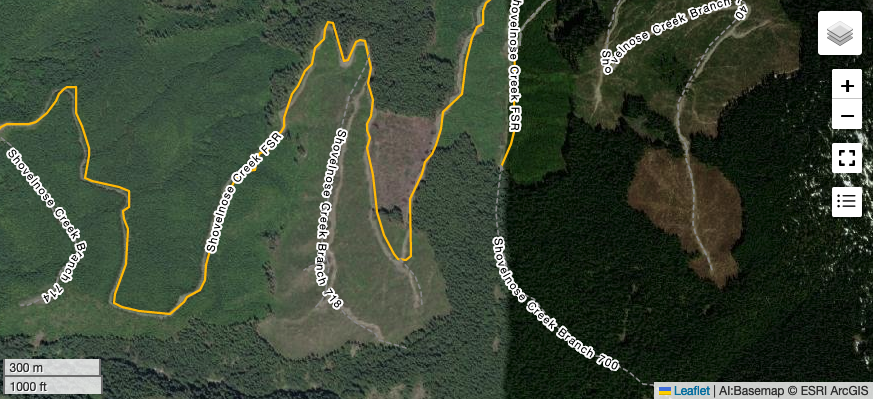
- Improved the legibility on street labels. The white outline too small and resulting in strange artifacts. This is now improved
December 4th, 2023 - Small SEO Updates
- Improved SEO descriptions and OpenGraph images so that the site will be easier to find through Google
- Fixed 404 error handling for road pages
December 1st, 2023 - Facebook Login is Live!
Facebook Login is now available through the login page! It has been my goal to have this feature enabled from the start, but other priorities took over. Many of the communities that might find this site useful are organized around Facebook Groups and so being able to seamlessly login and contribute has been a fundamental part of the experience I’ve been hoping to create. I originally created this site to improve on the existing services that are available. Many are behind a paywall or have a lacking user experience and I always felt that in order for a site like this to succeed, adding reports needs to be as frictionless as possible. The metrics and time will now tell whether this was a worthwhile addition, but if even 10% more users want to contribute via Facebook Login then that’s a success in my books!
Head over to the login page and try it out for yourself! Note that if you already have an account with the same email address as your Facebook, this login won't work. You'll need to continue to use your original email + password combination. For new users this should reduce any friction to sign up!
As for the technical details... because who doesn't love those? Well, it seems the golden era of Facebook API usage is over. Even Facebook Login which has traditionally been quite easy to setup, now requires a registered business and passing a vetting process in order to enable it. Thankfully, I was in a position to set this up, but I can see for most hobby style sites or personal projects it's a non-starter and that's a bummer.
The integration itself wasn't too challenging as Springboot does a lot of the heavy lifting for OAuth integrations. However, some thinking was required to figure out how to integrate Facebook users with the permissions system in use for locally registered users. I think I've found a tenable solution, although I'm not sure how idiomatic the approach is, but hey it's working. Time to focus on some other key features! A notification system has been asked a few times now as well as a means for editing photos on bulletins.
November 27th, 2023 - Minor Bug Fix
- Fixed a bug where zooming into certain parts of the map would cause the distance markers to reverse
November 26th, 2023 - Download Road Waypoints
- Well on my last trip we were trying to navigate along an old road and we inevitably lost it as it wasn't drawn on OSM or any other mapping applications.
- I've now added a "Download GPX" link to each road so that you can import it into your mapping app of choice! Note that you must be logged in to download the GPX file.
November 23rd, 2023 - Street Labels Are Now Live!
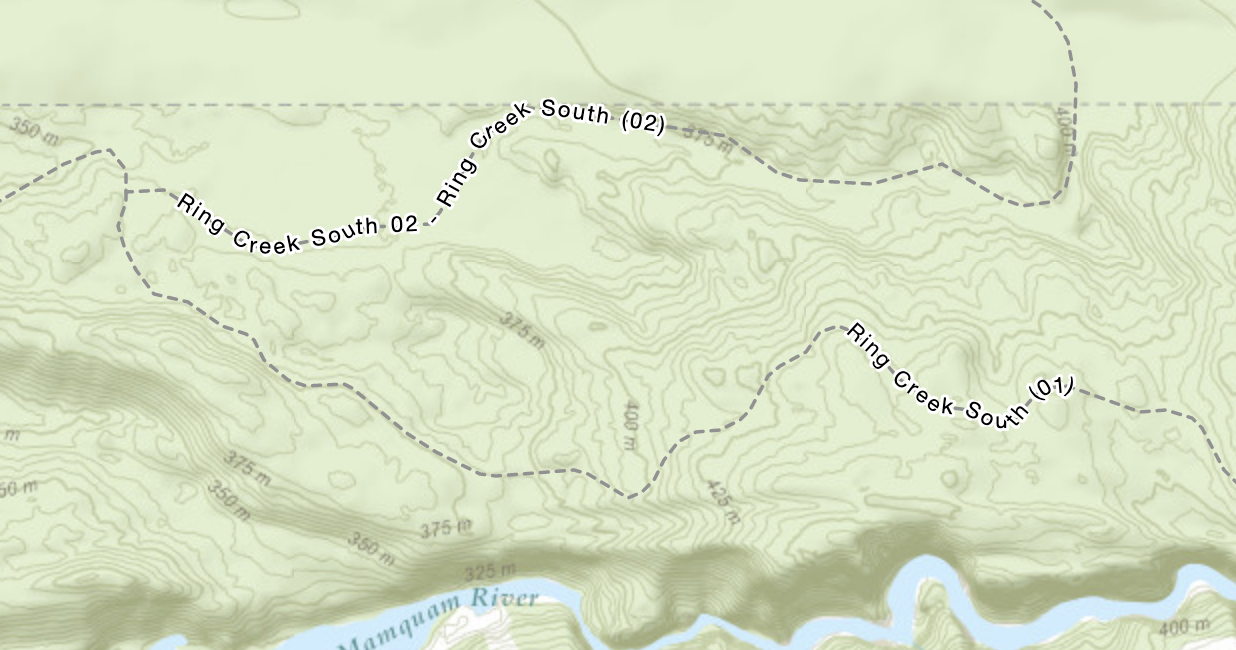
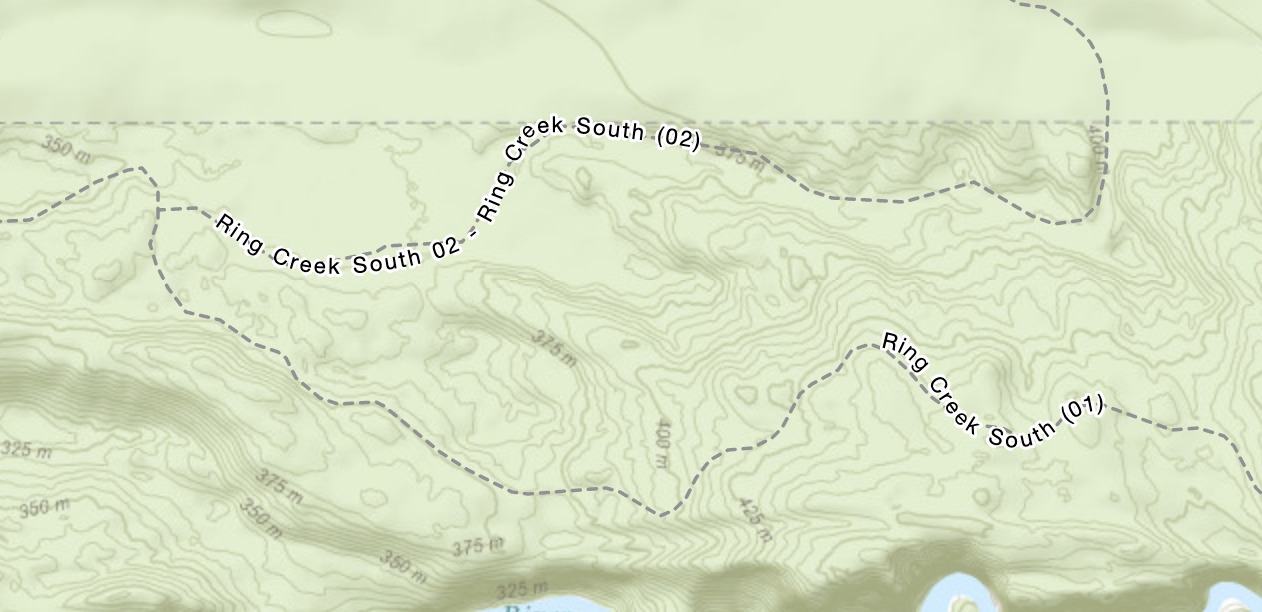
This was quite challenging and honestly the work is far from over. I've decided to release it in its current state to get feedback and to review the performance. I started out by using a Leaflet Plugin called StreetLabels. But it only worked well on very straight road segments and with numerous map breaking bugs. Adding to that FSRs have the unique property that they often have multiple steep curves and it makes rendering the road label quite difficult. To alleviate some of the problem I had to modify the plugin code quite heavily. I optimized the drawing of labels in a number of ways:
- First, I added more padding around the labels to improve the collision boundary so that its less likely that they will overlap
- Then, I wrote some custom logic to increase padding around the individual letters if the angle of letters changes more than a certain degree. This prevents issues where the letters would overlap on steep curves
- The next issue was that each road segment had a huge amount of waypoints. This resulted in the letters being drawn in a jittery fashion up and down along the road. I fixed this by using simplifying or removing excess waypoints before drawing the line. Thankfully an existing solution existed, so I just needed to copy and paste from https://mourner.github.io/simplify-js/
- As a final pass, I wanted to smooth out the path even further and reduce ultra sharp bends which would make the street labels illegible. For this I looked to a technique called spline interpolation. Again a nice algorithm in javascript was present already, so I needed only to apply it to the label drawing logic to make it work.
- I briefly tested out an algorithm for culling road labels where the roads had too many extreme bends to feasibly draw it well, but it was not performant enough and too liberal in removing labels. I think a better approach will be to find the straightest segment of the road and draw the label there instead.
November 21st, 2023 - Behind the Scenes Work
- Well, I'm finally back from vacation and dealing with jet lag, so the updates will trickle in slowly!
- Fixed a display issue with search results on the map where the text was not truncating correctly
- Updated/added roads around the Chilko Lake area and Lillooet. Many more to update still
- Added a privacy policy page here
- Starting work on login/sign up through Facebook. I have the login flow working and I'm just figuring out how to persist user registration info.
- This will hopefully reduce friction to sign up and enable more users to contribute
- As a final aside, we've now hit over 260 road reports since the site launched in the beginning of October. This is really really great! Thank you to all who have contributed
October 29th, 2023 - Persistent Login Sessions
- I've had to disable the distance markers now due to performance issues. Once I've resolved them, I'll re-add them back in!
- Added a nicer error page than what was getting displayed before
- Introduced persistent login sessions. Now if the app restarts, your session should active afterwards!
October 28th, 2023 - Minor Updates
- Added distance markers and start/end indicators to the roads when you are sufficiently zoomed in
October 27th, 2023 - Coordinate Optimizations
- I've made another round of optimizations for loading data on to the map. This time I'm reducing the precision of the coordinates being returned.
- The trade off is more CPU time to reduce the precision, but much faster loading time in terms of the amount of data being sent
- This is a nice short-term fix, but long-term I'd like to reduce the precision on the underlying data itself so that we don't need to compress the lat/lon coordinates when serving up the data. Furthermore, there is a good opportunity to reduce the point density as many roads have significantly more points than required.
- I forgot to grab screenshots but we see reduction in client side load times from ~1.8 seconds to ~1.2 seconds for areas that were previously serving up ~10.46MB of data. Nearly a 33% reduction in load times and ~6MB of data served up compared to 10!
October 25th, 2023 - Road Condition Ratings!
- Users can now rate the condition of the road in their bulletin. This will automatically update the road condition in the background
- Fixed a typo in "impassable"
October 24th, 2023 - Datastore Change Streams
- Fixed bug with adding bulletins where the form would submit before validating and you'd lose any photos you inserted
- Fixed bug with road distance calculation which was causing roads like Goat Main to prevent nearby roads from getting loaded
- Overhauled the data synchronization mechanism to use change streams
- Previously on every road update the system would also insert the data into several other tables depending on the changes
- However, if in that moment the datastore had a transient issue, data could fail to synchronize across all tables
- Now, data synchronization happens asynchronously via a change stream which ensures faster saves and a more reliable synchronization mechanism
- Cleaned up deprecated backend template logic with newer replacement
- Improve road layout on maps so that major roads are more obvious with thicker lines than smaller or worse condition roads
October 18th, 2023 - GZip Compression
- Fixed a bug when maintainers were editing roads causing the road not be saveable
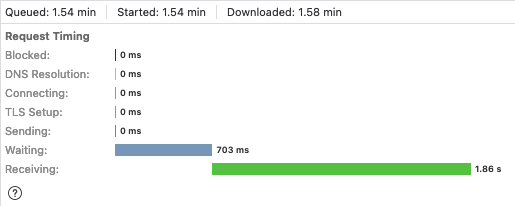
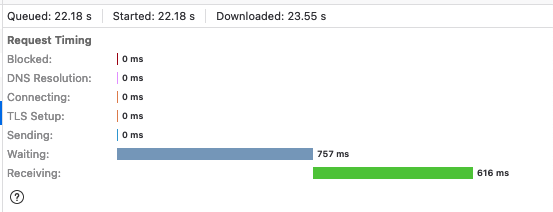
- Added compression on API responses which reduces load times by ~50%. This is an obvious fix, but nice to see the gains anyways!
October 14th, 2023 - Automated Flooding Monitors
- Implemented automated flooding monitors! The Squamish River FSR is the first to get support for this!
- An automated system will regularly poll river levels on the Squamish River. If those thresholds exceed the BC Government's defined thresholds, an automated closure notice will be posted
- When river levels are restored, the potential closure notice will be rescinded
- Added password reset form in case users get locked out of their account
October 13th, 2023 - Minor Updates
- Changed the recent bulletin feed to order by the date it was created as opposed to the date of the report
October 11th, 2023 - UX Improvements
- Added support for fullscreen maps and improved the user messaging to indicate when a map will display roads or not
- Fixed a number of roads around the Robie Reid area and continuing to clean up the Lost Creek FSR area as well.
- Incorporated better messaging when registration fails because the email provider is having issues
- Fixed a bug where bulletins that are modified by admins would include the admin's name not the original bulletin owner's name
- Improve the backend monitoring to ensure that registration flows are completing successfully
- Separate road condition from closure status and add special notice information to road pages
October 6th, 2023 - Minor Updates
- Updated the admin panel to now support adding new roads. This code change can also be used for a road suggestion feature I'd like to implement
- Fixed search results to now include aliases. That fixes a confusing problem where a search for an alias would only show the normal name
October 4th, 2023 - Minor Updates
- Fixed missing logout button